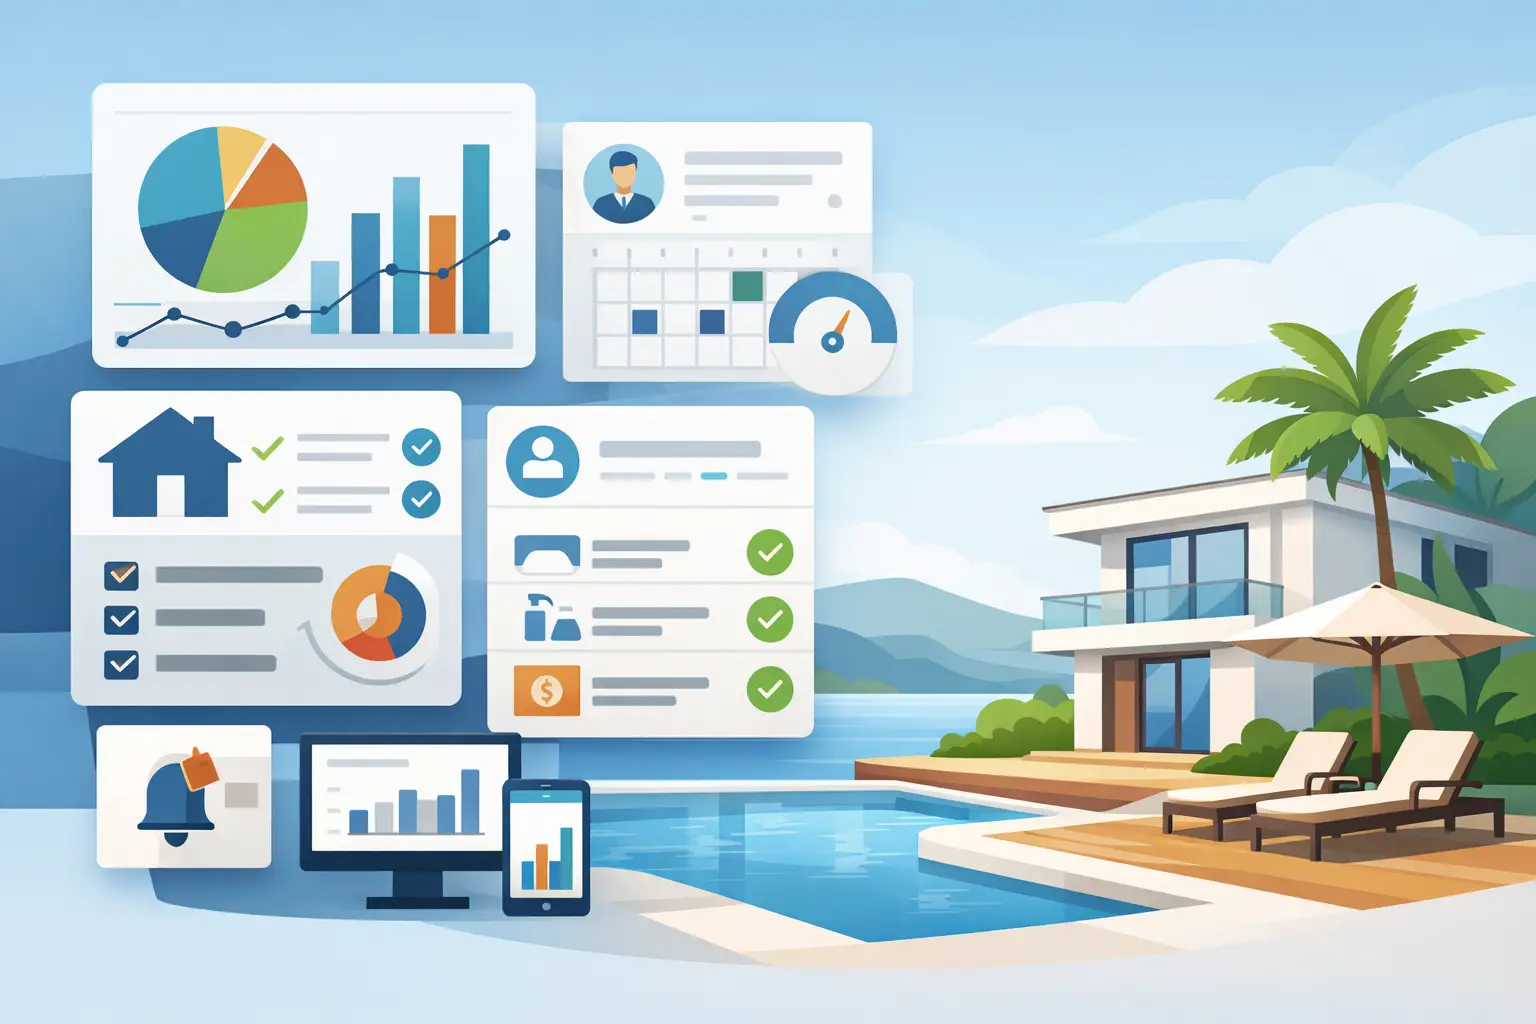
A missed turnover, a slipping occupancy rate, and an unresolved maintenance issue rarely appear in the same system. That is the operational problem a villa operations dashboard is built to solve. For managers of high-value villas and multi-property portfolios, the goal is not more reporting. It is a reliable control layer that shows what needs attention now, what is affecting performance, and where a decision can protect revenue or guest experience.
A dashboard is an operating system, not a report
Many property teams already have access to data. Their PMS holds reservations, channel tools track distribution, accounting systems record expenses, and messaging platforms contain guest conversations. Yet the daily operating picture remains fragmented. A manager may need to open five tabs just to confirm whether a property is guest-ready, whether a payment is overdue, and whether an arriving guest has a special request.
A useful dashboard brings those signals into one decision-oriented view. It does not attempt to replace every source system. Instead, it prioritizes the information that determines what a manager, revenue lead, or owner should do next.
That distinction matters. A monthly report explains what happened. An operations dashboard helps the team intervene while the outcome can still change. If a villa has a maintenance issue two hours before check-in, the relevant question is not how many work orders were created this month. It is whether the issue is assigned, whether the guest-facing impact has been assessed, and whether the property can be released as ready.
What a villa operations dashboard should show first
The best dashboard design starts with operating decisions, not available data fields. A portfolio owner needs a different level of detail than a housekeeping supervisor. Both need the same underlying truth, but their views should be calibrated to the actions they control.
Arrival readiness and live exceptions
For most villa operators, the current and next 72 hours deserve the most prominent placement. The dashboard should show arrivals, departures, occupied properties, open tasks, late cleanings, unresolved maintenance items, and any guest requests that could affect check-in or the stay.
Readiness should be explicit rather than assumed. A property marked “cleaned” is not necessarily ready if linen delivery is pending, the pool technician has identified an issue, or access instructions have not been sent. A stronger model uses a clear readiness status based on the conditions required for that specific property and reservation.
Exception-based visibility is especially valuable. If 18 villas are operating normally and two require intervention, the dashboard should put the two exceptions in front of the team. This reduces time spent reviewing green statuses and directs attention to potential service failures.
Revenue pace and booking quality
Operational visibility without commercial visibility creates a blind spot. A villa may be clean, staffed, and fully connected to channels while still underperforming its revenue opportunity.
At a minimum, decision-makers need current occupancy, booked revenue, average daily rate, revenue per available night, booking pace, and upcoming gaps in the calendar. These figures are more useful when shown against a relevant benchmark: budget, prior period, market target, or the property’s own historical pattern.
Booking quality belongs in the same view. Consider length of stay, lead time, cancellation exposure, channel mix, and uncollected balances. A high occupancy figure can look healthy while masking a weak rate position or a concentration of short stays that drive turnover costs. The dashboard should help teams identify the trade-off, not celebrate a single metric in isolation.
Maintenance, housekeeping, and vendor accountability
Service execution is where a portfolio either scales or becomes dependent on constant manual follow-up. A dashboard should surface work orders by urgency, aging, assigned vendor, property, and guest impact. The most useful question is often simple: what has been open too long, and who owns the next action?
Housekeeping performance should be tied to the reservation schedule. Track cleanings due, cleanings completed, inspections passed, turnaround time, and exceptions that prevent release. For large villas, the dashboard may also need task-level visibility for amenities such as pools, outdoor kitchens, golf carts, or specialty equipment.
Vendor data can reveal structural problems that individual task views miss. If the same contractor repeatedly misses service-level targets or a property produces an unusual volume of recurring repairs, operators need that pattern visible. The aim is not to monitor activity for its own sake. It is to protect asset condition, guest satisfaction, and operating margin.
Guest experience and risk signals
Guest experience is often treated as a post-stay metric. By then, the opportunity to recover the stay has passed. A stronger dashboard highlights live signals: unanswered messages, requests nearing their due time, negative sentiment, service recovery cases, and VIP or repeat-guest requirements.
Risk visibility should sit alongside service visibility. Depending on the portfolio, this may include payment exceptions, compliance tasks, access-code failures, incident reports, insurance-sensitive maintenance items, or owner-block conflicts. Not every risk needs an alert. Too many alerts produce noise and slow response. The dashboard should escalate issues based on urgency, financial exposure, and guest impact.
Design around roles, then preserve one source of truth
One oversized dashboard usually fails. Operations managers need queues and deadlines. Revenue managers need pace, pricing position, and inventory opportunities. Owners want a concise view of financial and asset performance without being pulled into every housekeeping task.
Role-based views solve this without creating competing versions of the data. The underlying definitions must remain consistent. If “occupancy” means confirmed booked nights in one view and includes owner stays in another, confidence in the platform declines quickly.
This is why metric governance matters. Teams should document how key measures are calculated, when data refreshes, and which system is authoritative when sources disagree. A dashboard can look polished while producing poor decisions if reservation status, property availability, or expense categorization is unreliable.
For example, a property that appears available may actually be blocked for maintenance in the PMS but still open on a channel because synchronization has failed. The dashboard should not merely display both statuses. It should identify the conflict and assign it to the appropriate team.
Build for action, not visual density
A common mistake is adding every available KPI to the home screen. The result looks comprehensive but forces users to search for what matters. Good dashboard design uses hierarchy: urgent exceptions first, near-term operating workload second, commercial performance third, and deeper analysis available when required.
Each priority item should answer three questions: what happened, why it matters, and who should act. A red maintenance indicator is less useful than a signal that says an HVAC issue at a property with a same-day arrival remains unassigned and may affect check-in. Context turns a data point into an operational decision.
Drill-down capability is equally important. A regional portfolio view may show rising maintenance spend, but the manager should be able to move quickly from the portfolio trend to the affected properties, recurring issue types, vendors, and reservation impact. High-level oversight and property-level accountability must work together.
A platform such as VillaPilot AI can provide this intelligence layer by connecting fragmented operational and performance data into a focused view for professional operators. The value is not another destination for raw data. It is faster recognition of the moments that require judgment.
Start with the decisions that cost the most when delayed
The right implementation sequence depends on portfolio complexity. A manager with 10 luxury villas may prioritize arrival readiness, staff scheduling, and guest request resolution. A company managing 200 short-term rentals may first focus on exception queues, channel availability, and revenue pace. A geographically distributed portfolio may need vendor performance and property-level compliance at the center.
Rather than launching with dozens of metrics, begin with a small set of high-consequence decisions. These often include whether a property is ready for arrival, whether inventory is correctly available, whether a service issue threatens a stay, whether revenue is pacing to plan, and whether a balance or maintenance risk needs escalation.
Once the team relies on those signals, expand carefully. Add metrics only when they change a decision, expose a repeatable pattern, or improve accountability. If a number never leads to action, it belongs in a secondary report, not on the operating dashboard.
The strongest dashboard creates a calmer operation, not a noisier one. When every property has a clear status, every exception has an owner, and performance signals arrive early enough to matter, teams can spend less time assembling updates and more time improving the portfolio.