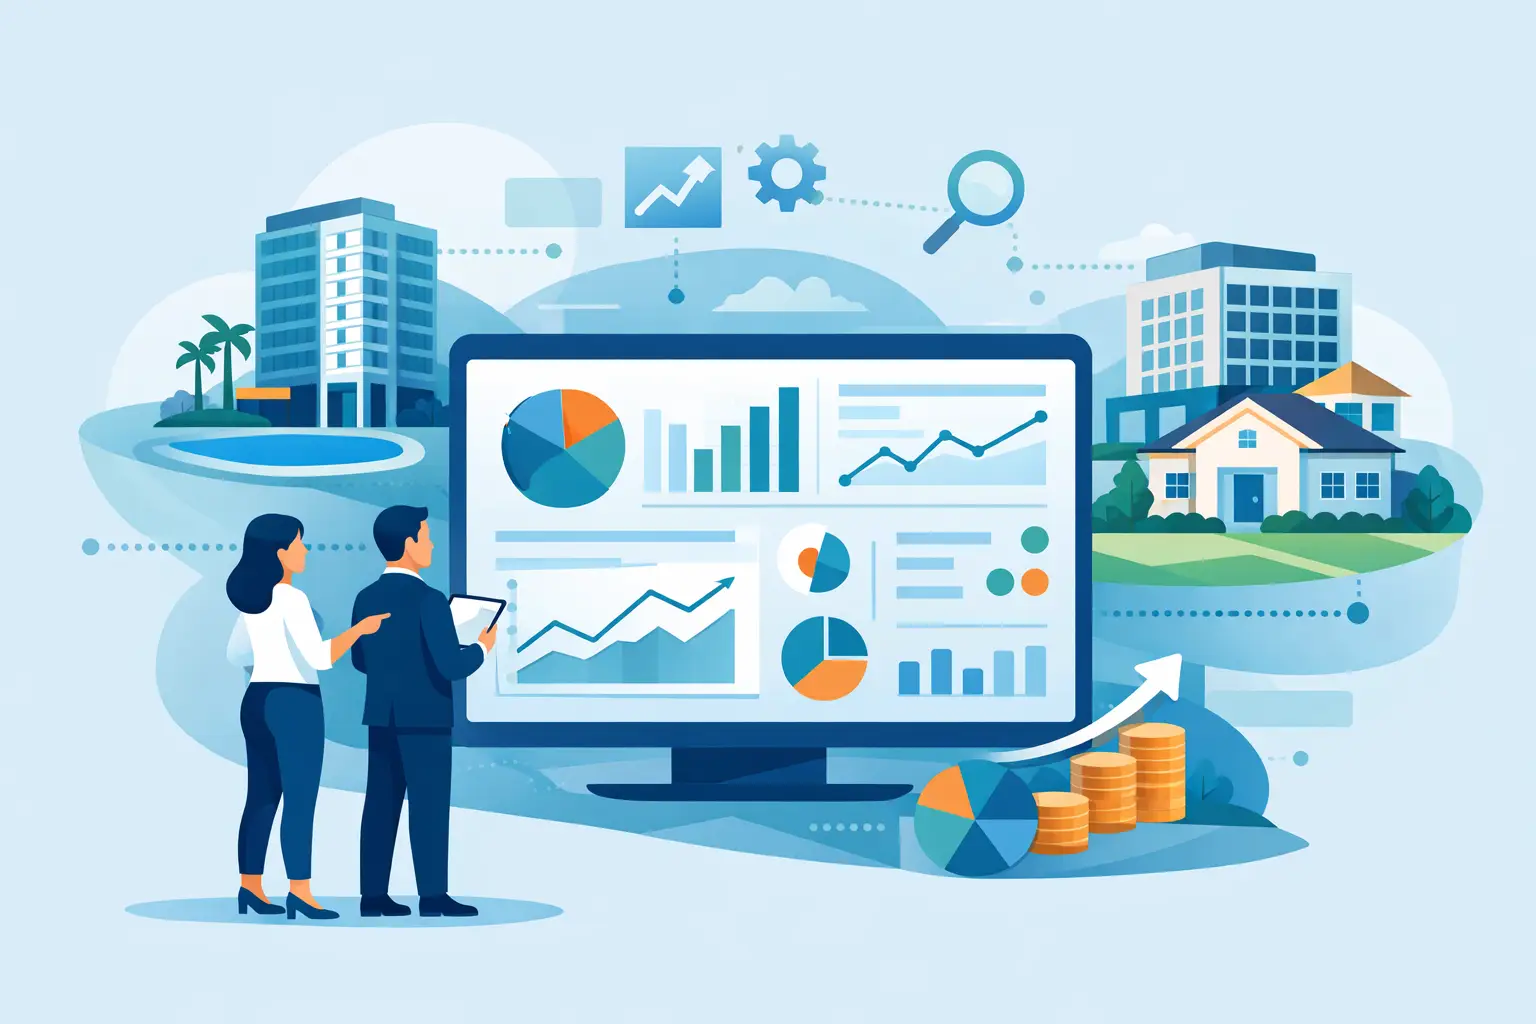
A portfolio rarely underperforms for one obvious reason. More often, the issue is hidden in the gaps between properties, systems, and teams. A multi property performance dashboard closes those gaps by turning scattered signals into one operating view - so owners, revenue leaders, and operators can see what is driving performance across an entire portfolio, not just at a single asset level.
For vacation rental managers, villa operators, and boutique hospitality groups, that shift matters. A strong month at one property can hide weak pricing discipline somewhere else. High occupancy can mask margin erosion. Good guest reviews may sit next to slow maintenance response times that are quietly increasing refund risk. Without a centralized dashboard, portfolio oversight tends to become reactive.
What a multi property performance dashboard should actually do
At a basic level, the dashboard should consolidate metrics from multiple properties into one interface. But for professional operators, aggregation alone is not enough. A useful system needs to show performance in context.
That means comparing properties against each other, against prior periods, and against targets. It should surface outliers quickly. If one villa is outperforming on ADR but lagging in occupancy, that should be visible without building a custom report. If one market is generating stronger RevPAR but worse labor efficiency, the trade-off should be clear.
The best dashboard does not just display numbers. It helps answer operational questions. Where is revenue leaking? Which properties are carrying disproportionate costs? Which teams are meeting service standards, and which assets need attention before the next booking cycle exposes a deeper problem?
Why fragmented reporting breaks portfolio decisions
Most multi-property businesses already have data. The problem is that it lives in separate systems - PMS data in one place, channel performance in another, guest communications elsewhere, maintenance updates in spreadsheets, and owner reporting handled manually.
That fragmentation slows down decisions in two ways. First, it creates reporting lag. By the time the weekly review is assembled, the conditions have already changed. Second, it creates interpretation risk. Different teams define the same metric differently, which leads to inconsistent actions across the portfolio.
A revenue manager may interpret performance through occupancy and rate. An operations lead may focus on cleanings, service tickets, and turnaround times. Ownership may care most about NOI, booking pace, and market mix. All of those views matter, but without a shared dashboard, they rarely align.
This is where a centralized intelligence layer becomes more valuable than another reporting tool. The goal is not more dashboards. The goal is a single source of truth that supports faster, higher-confidence decisions.
The core metrics that matter across multiple properties
A multi property performance dashboard should reflect both commercial and operational reality. If it only tracks revenue metrics, it will miss the service-side variables that affect future revenue. If it only tracks operations, it will miss the economics.
At the portfolio level, most operators need a clear read on occupancy, ADR, RevPAR, booking pace, lead time, and channel mix. Those numbers reveal demand strength, pricing execution, and where bookings are coming from. They also show whether growth is being driven by real pricing power or simply discounting.
But asset performance is only half the picture. Cost metrics matter just as much, especially for managers trying to scale without losing margin. Housekeeping cost per turn, maintenance spend by property, labor efficiency, refund volume, and incident rates can all reshape profitability even when top-line revenue looks healthy.
Guest experience metrics should also be visible, not treated as a separate category. Review scores, response times, issue resolution speed, and repeat guest patterns often provide early warnings before financial results move. A property with strong bookings and declining reviews is not a stable performer. It is a delayed problem.
Property-level visibility inside a portfolio view
One of the most common failures in reporting is forcing operators to choose between high-level portfolio summaries and deep property-specific analysis. In practice, both are necessary.
A good dashboard lets you start with the portfolio and then isolate a property, market, team, or date range in a few clicks. If one property suddenly shows lower conversion or rising service costs, the path from signal to investigation should be immediate. You should not need to export data just to understand what changed.
Benchmarks matter, but only if they are operationally useful
Benchmarking can help, but it often becomes noise when it is too generic. Comparing a luxury villa in one market with a mid-tier rental in another may create more confusion than insight.
Useful benchmarks are portfolio-aware. They account for property class, geography, seasonality, length of stay patterns, and operating model. Internal benchmarking is often more practical than broad market benchmarking because it shows where execution is breaking down inside your own business.
How operators use a multi property performance dashboard day to day
For leadership teams, the dashboard should function as a control surface. It should make weekly and monthly reviews faster, but more importantly, it should support daily prioritization.
A founder or portfolio owner may use it to spot underperforming assets and redirect investment. A revenue manager may adjust pricing strategy based on booking pace and channel trends across markets. An operations leader may watch for recurring maintenance issues, staffing pressure, or service bottlenecks at specific properties.
The dashboard becomes even more valuable when teams use the same interface for different decisions. That creates alignment. Instead of debating whose numbers are correct, teams can focus on what action to take.
This is where technology-forward platforms stand apart from static business intelligence setups. A modern system should not require technical effort every time the business changes. New properties, new service workflows, and new performance questions should be manageable without rebuilding reporting from scratch.
What to look for when choosing the right dashboard
Not every dashboard marketed to hospitality operators is built for portfolio intelligence. Many are single-property reporting tools stretched across multiple assets. That usually creates a crowded interface with weak cross-property analysis.
The better approach is to evaluate the dashboard based on decision quality, not visual design alone. It should be easy to compare properties, segment performance by market or asset type, and identify exceptions quickly. If every answer requires manual manipulation, the dashboard is not reducing complexity. It is repackaging it.
Data integration is another practical test. If your PMS, channel data, financial metrics, and operational workflows are not connected, the dashboard will always be partial. Partial visibility can still be useful, but it limits confidence at the exact moment a team needs clarity.
It also matters how the platform handles alerts and trend detection. Dashboards are often treated as passive screens, but professional operators need more than passive visibility. They need signals when performance deviates from plan. If booking pace drops at a cluster of properties or maintenance incidents spike at one asset, the system should surface that without waiting for a weekly review.
A platform such as VillaPilot AI fits this category when it acts as an intelligence layer across the portfolio, not just a reporting front end. That distinction matters because the value is not only in seeing data centrally. It is in translating that data into better timing, better decisions, and tighter operational control.
The trade-offs to consider
There is no perfect dashboard for every operator. A smaller portfolio may prioritize speed of setup and a focused set of KPIs. A larger hospitality group may need deeper customization, ownership reporting, and advanced segmentation.
There is also a trade-off between simplicity and completeness. If the dashboard tracks too few metrics, teams miss nuance. If it tracks everything, the signal gets buried. The right balance depends on how decisions are made inside the business. Most operators do better with a concise executive layer supported by the ability to drill down when needed.
Another factor is adoption. Even a strong dashboard fails if teams do not trust the data or use it consistently. Standardized metric definitions, clean integrations, and role-specific views all help. So does designing around actual workflows instead of reporting theory.
Why this matters more as portfolios grow
As a portfolio expands, complexity does not rise in a straight line. It compounds. More properties mean more exceptions, more team coordination, more market variation, and more opportunities for performance drift.
That is why a multi property performance dashboard becomes a strategic system rather than a convenience feature. It creates portfolio-level visibility while preserving property-level accountability. It gives leadership a clearer way to allocate attention, capital, and operational effort. And it helps managers move earlier, before small issues become expensive patterns.
For professional operators, that is the real value. Better visibility is not the end goal. Better control is. The right dashboard gives you a cleaner view of the business you are already running - and a sharper way to run the one you plan to build next.